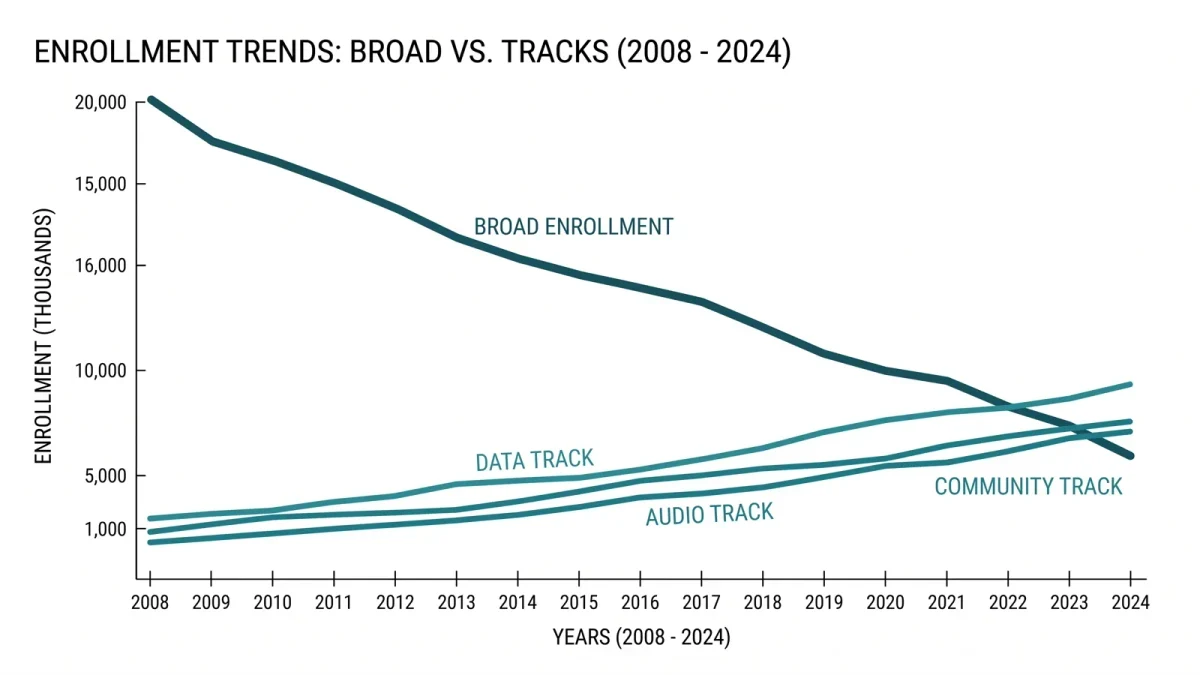
Kindergarten enrollment has largely recovered from its pandemic collapse: prekindergarten enrollment fell 22 percent — about 344,000 students — and kindergarten fell 9 percent — about 338,000 students — during the 2020-21 school year, per the National Center for Education Statistics, and enrollment rates for young children rebounded sharply afterward, with the share of enrolled five-year-olds rising from 79 percent in 2021 to 84 percent in 2022. What has not returned is total headcount, because a shrinking birth rate means fewer kindergartners arrive each year regardless of the pandemic: the nation's public schools enrolled about 49.5 million students in the 2025 Condition of Education report, still below the pre-pandemic peak.
Juvenile Pre & Post publishes information, not advice; enrollment rules and cutoff dates differ by state and district.
What actually happened to kindergarten in 2020?
Kindergarten is optional or effectively optional in many states, and in 2020-21 families voted with their feet. Per NCES data, hundreds of thousands of families skipped a pandemic-era kindergarten year rather than enroll a five-year-old in remote school — some held children back, some chose private options, some kept them home for a year. Prekindergarten fell harder because it is more discretionary still. The drop was not evenly distributed: districts serving the highest-poverty communities lost proportionally more students, and the youngest grades were hit worse than upper grades, where enrollment is compulsory.
How much has come back?
The recovery among the youngest children was faster than the headline numbers suggest. Per NCES, enrollment rates for three- and four-year-olds rose from 40 percent in 2021 to 47 percent in 2022, and five-year-olds from 79 percent to 84 percent in the same year — a rebound concentrated exactly where the losses had been. But rates and counts tell different stories. Total public school enrollment remains below its 2019 level, and NCES projections show long-term decline driven by demographics: fewer births since 2008 means the pipeline of future kindergartners shrinks each year almost regardless of policy. A district can fully recover its enrollment rate and still close a school.
Why does the distinction matter for families?
Because the two forces demand opposite responses. Recovery — convincing families the public kindergarten option works — is about trust, and districts that rebuilt it did so with full-day programs, clear communication, and in some states universal pre-K expansion. Demographic decline — fewer children in the pipeline — is about budget math, and it reaches families as school consolidations, larger catchment areas, and program cuts in the smallest schools. A family choosing a kindergarten today should ask which force dominates locally: a growing district adding sections behaves very differently from a shrinking one redrawing boundaries.
How should a family read local numbers?
Four questions get past the noise.
- Ask the district for five years of kindergarten counts. Districts publish enrollment by grade; the trend line matters more than any single year.
- Check the birth-cohort picture. A county's birth counts five years back predict kindergarten supply better than any school-board projection.
- Ask how the recovery was spent. Districts that regained students often expanded full-day kindergarten or pre-K — programs a family can use directly.
- Watch consolidation plans. Declining-enrollment districts publish facilities studies before they close buildings; reading one early beats hearing about a closure in spring.
What about redshirting and delayed entry?
The pandemic normalized the idea of holding a child back a year, and post-2020 kindergarten classes skew slightly older as a result. Research on delayed kindergarten entry is genuinely mixed — benefits depend on the child and the classroom — so the honest framing is that age at entry is a decision with real trade-offs, not a free advantage. What the enrollment data does support: children who missed pre-K entirely in 2020-21 arrived in kindergarten with less group experience than previous cohorts, which teachers spent the following years absorbing. For a family weighing entry timing now, the question is the specific child's readiness for a group setting, not the statistical shadow of 2020.
How do enrollment rules differ by state?
Kindergarten is not compulsory in most states, which is the legal fact underneath the 2020 collapse — where attendance is optional, families can skip the year, and hundreds of thousands did. Two rules vary by state and matter more than any other detail. The cutoff date: states set the date by which a child must turn five to start, ranging from June to December, and a summer birthday near the cutoff is the classic borderline case. And compulsory age: in states where school becomes mandatory at six, kindergarten itself remains a family choice, while full-day versus half-day offerings are set district by district. A check of the district's enrollment page and the state's cutoff answers both in minutes.
What does research say about the lost pre-K year?
The 2020-21 prekindergarten cohort has now moved well into elementary school, and researchers have tracked what the missed year meant. The consistent finding is moderation: children who skipped pre-K entered kindergarten with less experience in group settings — sitting in a circle, sharing adult attention, handling transitions — and kindergarten teachers spent much of the following years absorbing that gap. But kindergarten and first grade themselves proved to be powerful equalizers for most children, which matches the broader research that early-childhood programs show their largest effects on school-readiness behaviors and smaller durable effects on academic skills. The students the missed year hurt most were those who would have qualified for targeted programs — special education preschool services among them — which is why the disruption's longest shadow is in special education identification timelines that shifted by a cohort.
What does the demographic decline mean long term?
The pipeline math is slow but relentless: births drive kindergarten enrollment five years later, and births have trended down since the 2008 recession, per federal demographic data. NCES projections show total public enrollment declining over the coming decade, with the effects concentrated unevenly — growing districts in the South and Mountain West, shrinking ones in the Northeast and Midwest. For a young family choosing where to live, school-catchment research now belongs beside commute math: a district's five-year kindergarten trend and any facilities study on its website forecast whether the neighborhood school will be adding programs or consolidating them by the time a toddler arrives.